Balls
First, I hate myself for having done this. But sometime after the Patriots were first caught deflating their balls, Sharp Football Analysis released a trilogy (also here and here) of pieces about the statistical (un)likelihood of how (in)frequently the Patriots fumbled the football. The presupposition being that an underinflated ball is easier to hold on to, so if the Patriots had been systematically deflating balls for seasons it would show up in their relative lack of fumbles.
The original piece was dismantled by this post at Deadspin. And that was mostly that… until last week when the NFL released the Wells report and launched a few million flammable and inflammable takes. Amongst them was a contentized chat at 538 where someone suggested “that some of those outlier Patriots stats deserve a second look…”
So this is that. There are probably others.
Second, I am Patriots indifferent. I don’t like them. I don’t hate them. I have no emotional stake in whether they win, lose or cheat. I was probably pulling for them in the last Super Bowl, but that’s almost entirely down to the fact that I really don’t like Pete Carroll.
Anyway, the Sharp posts read like they started with the idea that the Patriots were guilty, then just keep begging the question numerically until they convinced themselves what they probably already believed. Grouping the teams into 5-year intervals—the time period used by Sharp—seems specifically chosen to squelch single-season fluctuations in a way that serves to make the Patriots really look like cheaters.
Since 2007, there are over 250 team seasons of NFL data1. It actually takes more effort to collapse that into 5-season groups, so we’re just going to be lazy yet somehow still be better off. And 250-plus team seasons gives us a pretty decent sized dataset.
So the first thing we do is get rid of all the fumbles on punts and kick offs. The league uses k-balls on punts and kicks. What are k-balls? For each game a dozen balls are kept in a sealed box and not opened until two hours before kickoff in the officials’ locker room. These balls are marked with a ‘k’ and used by both teams for punts, kick offs, field goals and extra points.
They are just different balls than those used on offensive plays (the ones teams get to inflate to their liking within certain specifications), so we pull fumbles on kicking plays out of the data altogether. Plus, I’m not sure how much letting defenders take a 60-yard (mostly) free run at you while you stare into the sky and try to catch something is analogous to a running back getting a 5-yard head start to run into a (mostly) stationary line of 350 pound pituitary freaks.
Here’s a dotplot of fumbles per play for every NFL team from 2007-2014. Each season is its own dot, so each team appears 8 times in the plot (here’s a list of the top 35 numerically). The Patriots are the teal-aqua dots2.
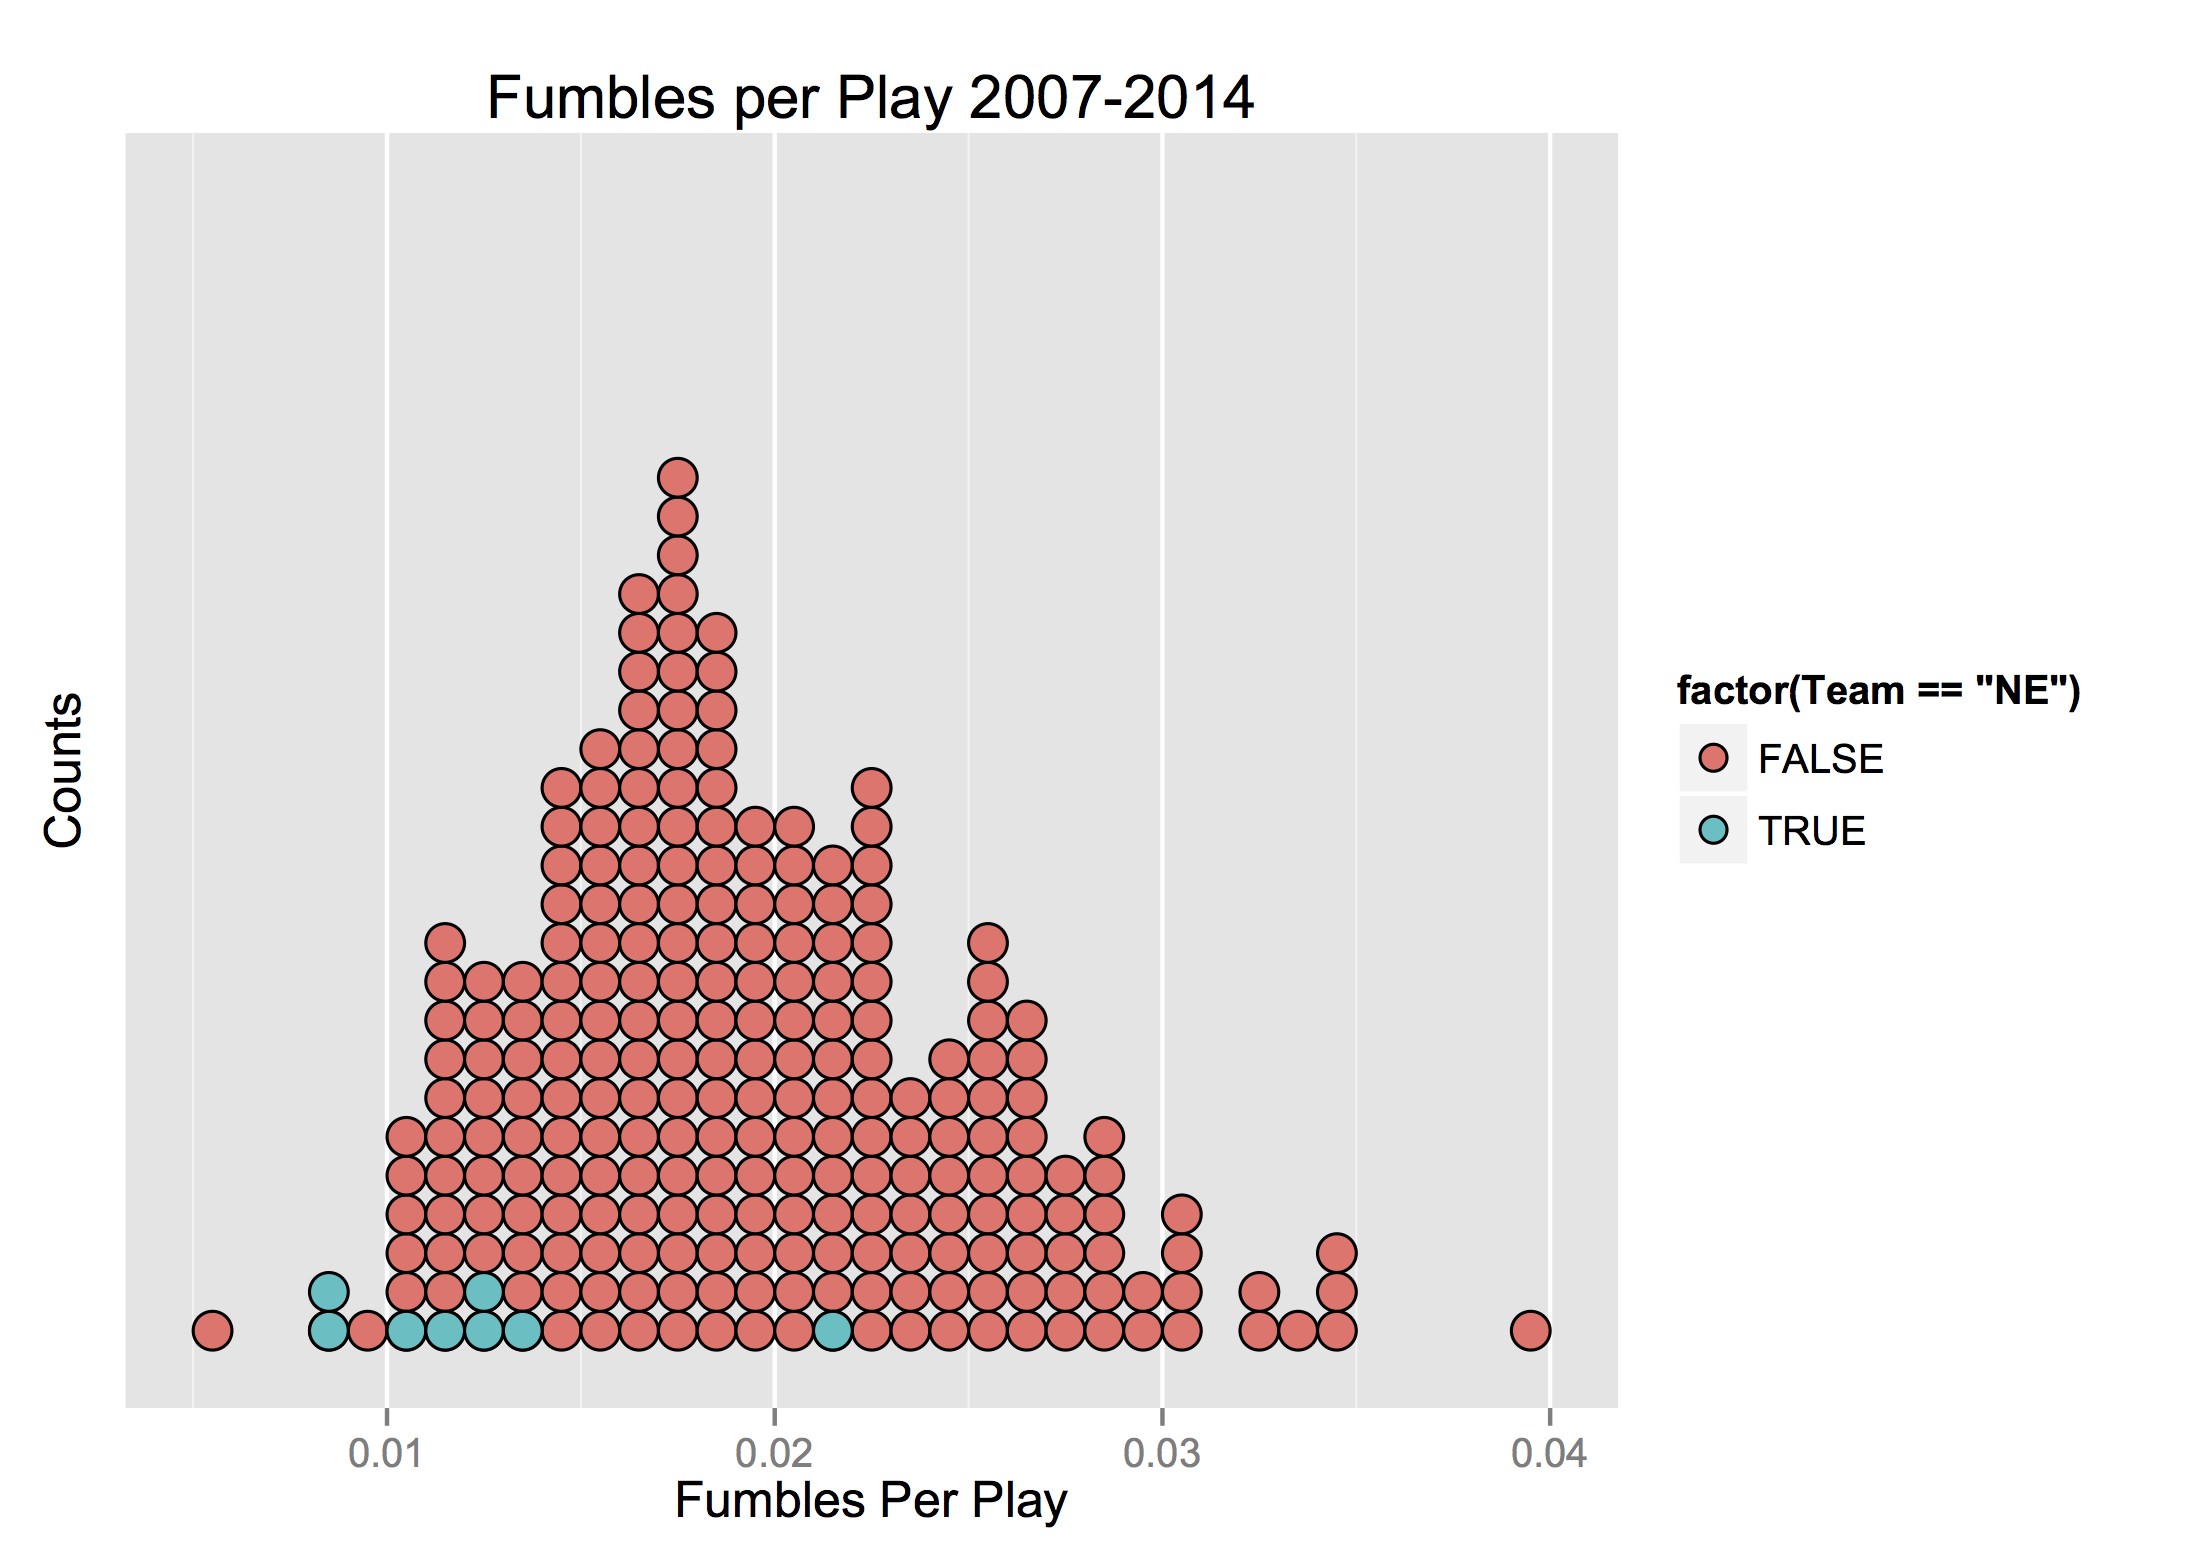
The Patriots don’t have the single best season. That dot on the far left? That belongs to the New Orleans Saints for the 2011 season. The Saints fumbled all of six times that season (although they lost five of them). Yes, the Saints are a domed team. Yes, playing half your games in a climate controlled building maybe helps (more on that later)3.
Here’s the first place I diverge from both Sharp and the anti-Sharp piece on Deadspin (which I’m in agreement with most everywhere else). This data isn’t normal4. That’s totally okay, though. We can still assign some probabilities and look at how likely some of these things are. We’re counting things (fumbles) over an interval (an NFL season), so we can use a Poisson distribution. It doesn’t matter if you don’t know what that is. Anyway, of the four best New England seasons, a couple aren’t particularly likely but none is overtly ridiculous.
Season Fumbles Likelihood
2010 8 1-in-529
2011 9 1-in-246
2012 12 1-in-45
2007 12 1-in-45
For comparison sake, that New Orleans six-fumble-season is about 1-in-35505.
Remember, we’ve got over 250 seasons, so we shouldn’t be too surprised to find a 1-in-246 event (although there are two—Atlanta 2012). But the four best Patriots seasons, they do have small probabilities. Eight fumbles is about .0035; nine is about .00686. So, does this mean the Patriots cheated or what?
They have two seasons that are below a 99% cutoff, and an additional two below a 95% cutoff (although just barely). Those are common standard thresholds used in stats. If you’re doing a strict test, you would reject your null (i.e. reject “Nothing unusual here. Move along.”). That doesn’t necessarily mean Patriots=Cheat though.
On the other hand, the chances that the Patriots would have four seasons where they averaged 10.25 fumbles per season (their four best seasons), that’s about a 1-in-60,000 event. That’s a little harder to rationalize away (to anyone outside New England… inside New England cognitive dissonance is seemingly available in near infinite supplies).
Of the five “best” overall seasons for holding on to the football (since 2007), the Patriots have two of them. But the Saints also have two of them. And both of the Saints’ seasons are also beyond what we’d expect to see statistically (at 99%). Looking at the three best seasons for both the Saints and the Pats, it’s the former who look like they have some sort of magical ball-retention skill, even if just by the slightest of margins.
Team Fumbles per Play
Saints 0.008628619
Patriots 0.008835696
“But the Saints play in a dome!” Again, yes, yes they do. And we also cherry-picked here to make the point that, even for multiple statistically aberrant seasons (and exogenic factors not withstanding), the Patriots are not alone. And God help the Saints if Roger Goddell goes after them again.
Now what if we did something totally crazy? In any given season, the Top 20 fumblers are almost exclusively quarterbacks. And most of those fumbles come on passing plays. On those plays, the QB is looking downfield trying to find an open receiver while also trying not to get hit by a defender. Sometimes they are not successful. During those moments, a quarterback is nothing like a normal ball carrier. They don’t have the ball tucked away in some iron forearm grip specifically for the purpose of protecting it. It’s close to the opposite; they likely have one hand on it in preparation to throw it. If they get hit when the ball is least protected, there is a decent chance they fumble it. QB fumbles happen at a rate at about 1:4 to every QB sack.
So for grins, let’s throw out all QB fumbles, because A) that’s the player who is usually responsible for the most fumbles on any given team and B) they fumble in situations that, for the most part, don’t resemble those of all the other fumblers (we’ve already gotten rid of kick returners).
Now our list looks like this (the last column is the Fumbles Per Play after removing kick and QB fumbles):
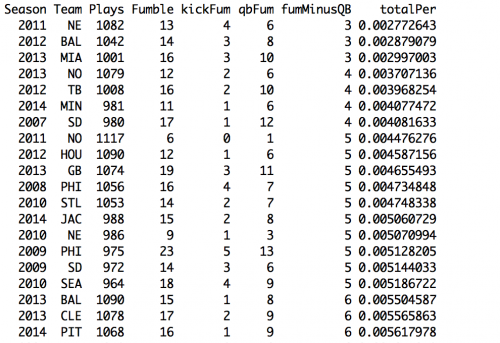
Yeah, that one Patriots season (2011) is tops, but the rest?… Baltimore8, New Orleans, Tampa Bay, Minnesota, San Diego. New England doesn’t pop up on the list again until number 14. If an owner or GM wanted to really effect ball security, they’d be way better off investing in the offensive line than having a QB deflate balls by half pound below the allowable PSI.
It’s also worth pointing out that 2011 was a banner year for ball security. In the eight seasons since the change in inflation protocol, there were fewer fumbles in 2011 than any other season, that’s true of both total fumbles (for everything) and fumbles once k-ball plays are removed. In fact there is a curious drop starting in 2011. The average of the four seasons prior (2007-2010; all fumbles) is 740 per season. From 2011 on, it’s only 663.75 per season (about 77 less per season).
Not only that but in every season since 2011, the total is less than any of the four seasons prior. Is the NFL punishing the Patriots for manipulating balls during a period when the NFL itself manipulated balls? For all I know there is some published change in the balls (manufacturer, materials, etc.) that the league was very public about. But if not, hey look, free story idea for someone.
It’s probably terrible to assume QBs only (or even mostly) fumble when they are trying to pass and maybe getting sacked. There are plenty of plays where QBs take off and run because the pass play breaks down or by design. Some QBs—Newton, Wilson, Griffin, etc.—are valuable as runners and once they cross the line of scrimmage they are absolutely more like a running back with regard to fumbles than a pocket passer. But it’s pretty obvious that how often a QB fumbles has a massive impact on the total team numbers.
So, lastly, I went the other way. Instead of throwing out QB fumbles, I took only QB fumbles and for fun—okay, not actual fun, but intellectual fun—I made a really quick and dirty—and not dirty fun—model for how often QBs should fumble7. The model has as inputs: the season, the team’s division (maybe because of geography you face a team really good at forcing turnovers twice), the total plays run, the number of passing plays run, whether the team plays its home games in a dome or outdoor stadium, the number of QB rushes and the number of times the QB was sacked.
And hey, look who has the biggest difference between predicted and actual number of fumbles:
The Oakland Raiders. But that’s in the other direction. In other words the Raiders actually fumbled almost 30 times more than predicted, because, ha, LOLRaiders.
But on the other end of the list—fumbling less than predicted—the team QBs who have the largest positive difference between their predicted and actual fumbles… Yeah, it’s the Patriots.
Now for all teams, this is all QBs from 2007 to 2014. So the Raiders number contains the predicted-minus-actual fumbles for JaMarcus Russel, Bruce Gradkowski, Jason Campbell, Kyle Boller, Carson Palmer, Matt Leinart, Terelle Pryor, Matt McGloin, Matt Schaub, etc. It’s that way for every team. So the Patriots number does include the 2008 season when Brady played about six minutes of the first game before shredding his knee (I think). So we’ve got Matt Cassel’s numbers in here.
That’s okay. First, we’re staying consistent across all teams. Second, what’s to say that anything changed about the way the Patriots handled balls pregame with Brady injured? We’re not operating under the assumption that the Patriots were underinflating balls then looking for places where they might not have happened. We’re not making any assumptions about the balls at all. We’re just looking at data. Given that, we’re not throwing data out without a really, really good reason.
And it’s not just that the Patriots QBs fumbled way less in absolute terms, the difference between the Pats (best) and KC (second best) is even more pronouced when looked at as a percentage of total predicted fumbles.
In other words, this:
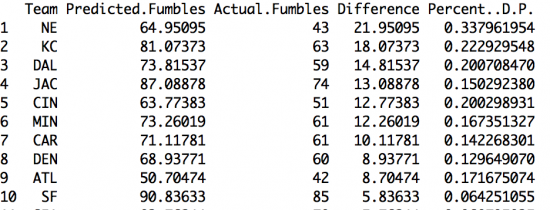
Brady (with an assist from Cassel) fumbled almost 22 times fewer than predicted (fourth column). The Chiefs QBs were second with about 18. But the Patriots were also predicted to fumble about 16 times fewer than the Chiefs (65 for the former versus 81 for the latter). The ability of Brady to hold on to the ball is even more gaudy when looked at relative to the number of predicted fumbles (and the Pats and KC are 1-2 in both metrics if you’re wondering). That’s what’s happening in the last column; we’re dividing the difference between predicted and actual by the total number of predicted.
It’s almost like there’s not a single thing you can think to look at where the Patriots don’t come out on the suspicious side of “Hmmm…”9
So did the Patriots materially effect the outcome of games by manipulating the air pressure in the game balls? Fumbles—and turnovers in general—are really important. If you win the turnover battle in the NFL you win something like 75% or 80% of your games10. If a team can effectively decrease the probability of fumbling, then, yeah, they are gaining an advantage.
Before I even pulled a single piece of datum, I was team ‘they probably did it’ but that’s almost entirely because the Patriots always seem to be trying to figure out which rules they can exploit and which they can ignore (let me be clear: I didn’t take that belief into working with the data to try to prove it; it was more background noise because, well, this isn’t the first time). You only have to drop a brick on your foot so many times before induction kicks in.
Now, just based on the stats, you’d have to be a Pats fan or a lawyer to wantonly ignore what the math implies. But even then, if you look at seasons individually, you don’t have to bend your mind too far to think the Pats are just really good at not fumbling (that could be attributed to any number of totally legitimate things).
There is no ‘proof’ here. Stats are almost never proof. For the most part it’s just assigning probabilities to what you can observe. Moreover, this all starts from the notion that a slightly underinflated ball will directly result in better ball security. That seems plausible, but someone should try to establish for certain that, within in the ranges were talking about (maybe .5 to 1 PSI), it makes a measurable difference in how often a player fumbles.
Without that, all the math matters even less.
1 We start with 2007 because that’s when the NFL changed the rules that allows each team to inflate their own balls as long as they are between 12.5 and 13.5 PSI. Also, people asking for the data, I just copy-pasted from NFL.com, then just exported to a csv. So if you want the data it literally takes less than five minutes to collect.
2 Do not infer from the color scheme that I am a Dolphins fan. The aqua-ish orange-ish color palette is the default in ggplot (the R package used to generate the plot).
3 In 2011 the Saints had, from a conditions standpoint about as ideal of a schedule as a team could hope for: Eight domed games at home, three domed away games, and, of their five remaining away games, only one was played with a kick-off temp below 68 or above 84 (that was 41 degrees at Tennessee). No rain in any game either. Close to perfect.
4 Here is the Q-Q Normal plot for the data. I also ran the Shapiro-Wilk test for normality. The p-value .00167 was well below the .05 threshold used for normality.
5 So, if you’re observant, you’ll notice a slight mismatch. The 12-fumble seasons have the same probability here, but they sit in a different places (different columns) in the distribution. That’s because in the graph we’re plotting per-play, but to do the math for the Poisson we have to used a standard interval (every team has a 16-game season, even if they run a different number of plays per season). So the graph is fumbles per play. The probabilities are fumbles per season. Not every team runs the same number of plays in a season.
6 It turns out that with a small correction, a Poisson distribution is a pretty good approximation to the normal in many instances. What? Basically, after doing some 1st grade addition, we can use the normal here anyway. Also: So why the disagreement with our calculations from the Poisson (i.e. 1/.0035 is 1-in-286, not 1-in-529). Here were looking at the probability of 8 fumbles or fewer, 9 fumbles or fewer. Our Poisson probabilities were giving us the number for exactly 8 fumbles or exactly 9 fumbles. Again, we’re using approximations, but if we look at cumulative Poisson probabilities (to correspond to our cumulative normal probabilities) our answers get pretty close. Nine or fewer fumbles by the normal approximation is about a 1-in-140 event, by Poisson probabilities it’s a 1-in-147 event. So, the math works. The former is a decent approximation of the latter.
7 The model is just okay (R^2 of .3) but our predicted values do get 20 of 32 teams within +/- 10 of their actual fumbles. Moreover 22 of 32 are +/- .15 of the ratio between the Difference and Predicted fumbles. So it’s not terrible. Oh, also this is the ‘more on that later’ part of the comment about whether playing in a dome means you fumble less. The coefficient on playing indoors is negative (so, in the model, playing in a dome does decrease predicted fumbles) but the coefficient is not significant (p-value > .05). But again, this is just QBs so I wouldn’t put any gambling money on that as definitive. Here it’s merely interesting.
8 Joe Flacco, Not elite
9 This isn’t strictly the case. I should note this all started when I was doing something completely different. Originally I was looking at the difference between Patriots runnings back before and after they were with the Patriots. Of particular note, BenJarvus Green-Ellis had zero fumbles in about 530 carries with the Patriots, then he had five fumbles in about the same number of carries with the Bengals (the latter is right in line with the league average by the way). Anyway, I initially built a dataset of RB’s that had a bunch of carries with one team, then a bunch of carries with another, then took the differences. Compared to that, Green-Ellis’ bump was not statistically significant. In other words, it wasn’t anything you wouldn’t expect to see in the normal fluctuation in rates between an RB with Team A, then that same back with Team B. I dumped that because some of the RBs in the sample pre-dated the 2007 season. Once you removed those, the dataset was only like 25 RBs. Anyway, people pointing to Green-Ellis as ‘proof’ of something probably should point elsewhere.
10 Huge caveat: I’m going from memory of a stat in one of the Sharp’s posts. I think it was just south of 80%. I try to stay out of taking personal shots, but I’m pretty sure it was next to some comment that was like: A 12-5 record equates to 75% wins. Oof… Everyone makes mistakes, though.