When Five-Month Old Posts Are New Again, or: Hack the Official
NOTE: This was originally written for Deadpsin and was going to run before the last Arsenal v. Chelsea game at the end of last season (April 26, 2015). It somehow fell into the Internet equivalent of turnaround and never saw the light of day. Given Mike Dean’s performance at Stamford Bridge this weekend (September 19, 2015), it seemed worth posting. The data (or anything else) here hasn’t been updated since the text was written last spring. The only edit is the addition of a second footnote.
Arsenal fans probably weren’t particularly tickled to see they drew Michael Oliver as the match official for Chelsea’s visit to the Emirates this weekend. The Gunners’ record with Oliver in charge: Won 2, Drew 3, Lost 5.
That .200 winning percentage is suspiciously low for a team that has averaged better than three times that over the past three seasons. But small sample and all. Arsenal’s bigger problem is that they are playing at home. Normally that’s considered an advantage. And it usually is. But, according to the massive plot of plots here (pdf link, but you should click it because it’s probably the most important thing in the post), that tends to be less of the case when Oliver is involved.
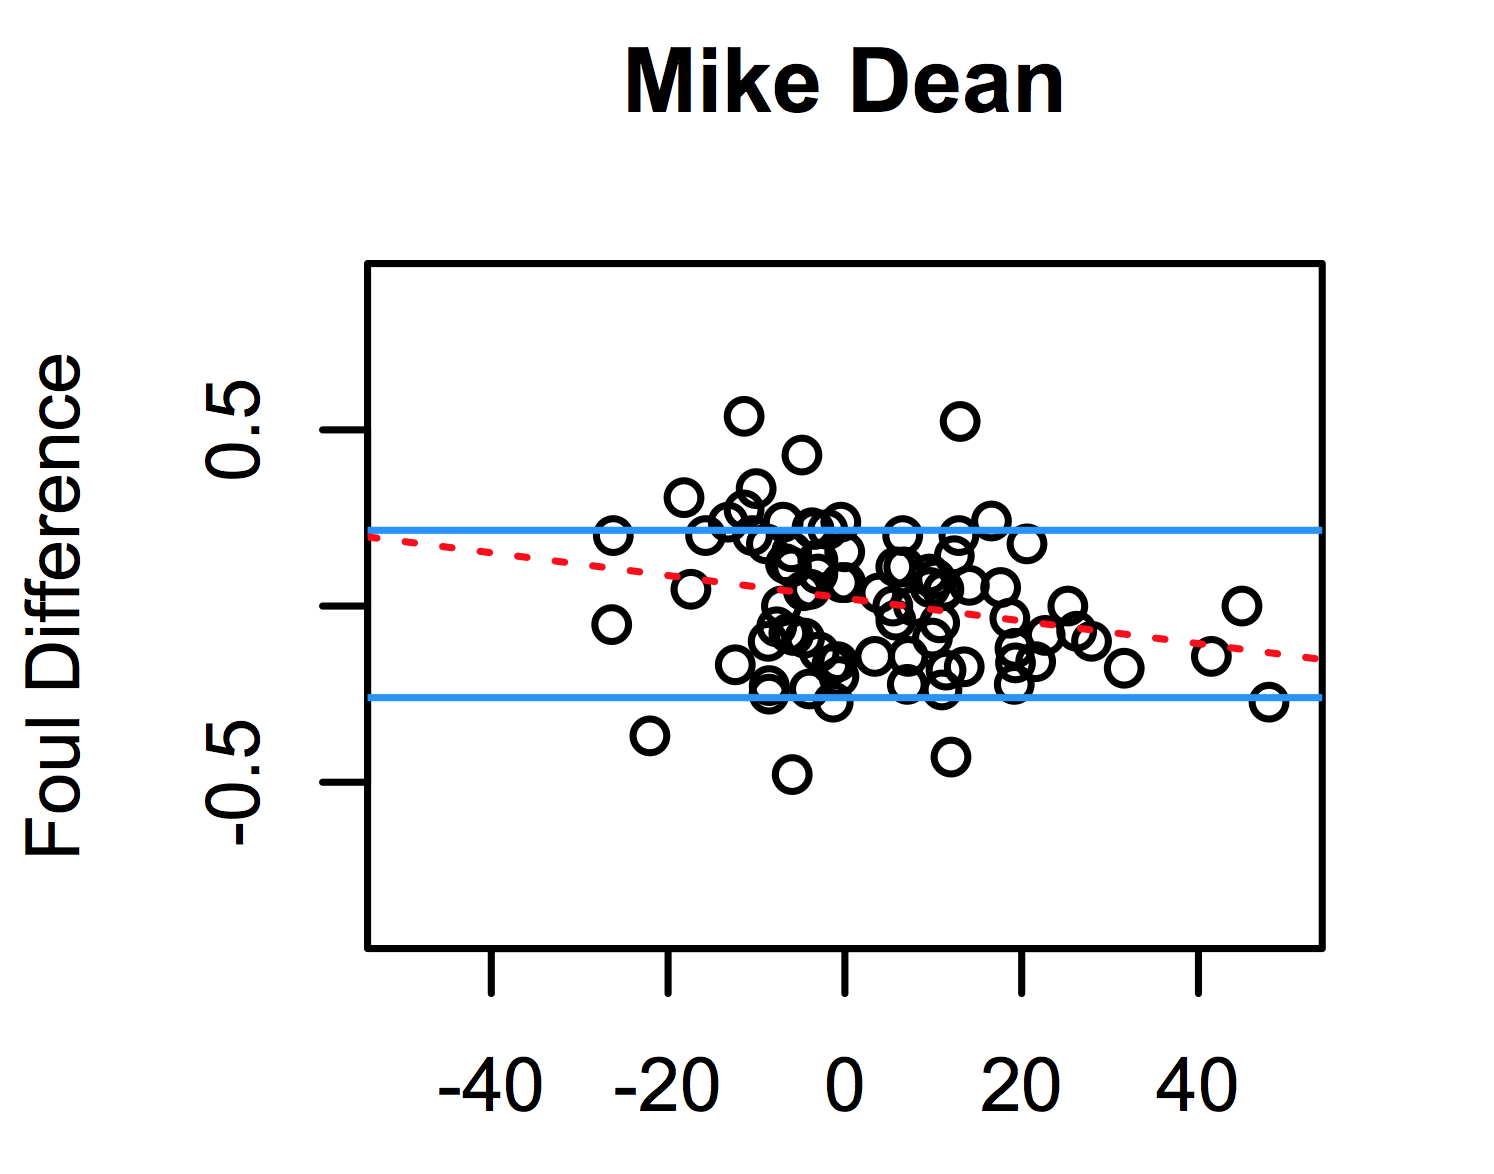
Those are official-specific plots—hopefully that’s obvious—of how many fouls each calls on the home or away side relative to how much possession the teams have.
Huh? So, the main thing to keep in mind when reading this is “home minus away.” Each point represents a single game. On the y-axis, we’ve plotted the number of times the home team was whistled for committing a foul in a game minus the same for the away side. That number was then divided by the total number of fouls called. The idea being that a difference of -5 whistles would be pretty embiggened in a game with only 15 total fouls as opposed to the same differential in a game with, say, 45 total fouls. So this is an attempt to contextualize the difference to its game.
On the x-axis, again it’s home minus away. Here, it’s the amount of possession for the home team minus that of the away team. And this is just straight percentage. At +20 on that x-axis that means the home team had 60% of the ball to the opponent’s 40%.
The blue lines are there partially to give a consistent visual reference across all the plots. But they also indicate a threshold for a sizable difference between the number of fouls called against the home and away teams1 (one is at + .21 and the other at -.26), so they aren’t entirely arbitrary. The red lines are correlations for each official.
So what do we see? Well, two things are pretty clear. First, if you are the away team in the EPL, you never want the sight of Michael Jones walking out of the tunnel. It’s almost like he’s cognizant of the threshold we set on the top end for home teams and makes a conscious effort never to exceed it. Remember the New Year’s Day 2-2 draw between Liverpool and Leicester? The one where Liverpool got two dodgy penalties at Anfield (including one when a ball hit Wes Morgan in the face and not his hand)? That match was officiated by Jones. He’s gold for home teams, gold.
Second, we don’t see a whole lot of referees behaving like they should. There are maybe four: definitely Neil Swarbrick; probably Jonathan Moss and Kevin Friend; and maybe Howard Webb (I know, right?).
So the question is: how should referees behave? Intuitively the number of fouls a team commits seems like it ought be a function of how much defending they do. The equivocating (‘seems’, ‘ought’) is intentional because this might be absolutely wrong, and as long as Tony Pulis is in the Prem, all bets are off anyway.
But when a team is defending, they generally try to do things to stop the other team from scoring. That’s pretty much the definition of defense. Tackling, trying to muscle players off the ball, being Ryan Shawcross; those are the inherently risky physical acts that lead to fouls. The more time you spend defending, the more you are probably doing those things.
So most of the red correlation lines should be downward sloping: home team has more of the ball, the away team fouls more; away team has more of the ball, the home team fouls more. There is a little of that, but we don’t see particularly strong correlations (outside of maybe the four officials mentioned above). Mark Clattenburg cares diddly-squat for who has the ball more. He’s flatlining.
We do see some points in the bottom right area of the plots (home team with the ball; away team fouling), but what we see far fewer of are points in the upper left hand parts of any of the graphs. That’s the area that represents the away team dominating possession with the home team being whistled for lots more fouls. We can even put a number on the disparity between the two areas (lower right/upper left).
Take a 20% possession difference. And this is absolutely arbitrary. I just picked it. But that means one team has at least 60% or more of the ball, and the other team has no more than 40% of it. That seems like a decent-sized disparity. That filters out 167 games where the home team is +20% possession and 158 games where the away team is +20%.
Of those, 45 and 19 exceed their respective foul-disparity thresholds (our blue lines). In other words:
Bottom Right: 45/167 or 26.9%
Top Left: 19/158 or 12.0%
Put even more simply: about 1 in 4 times when the home team has a lot more possession, the away team gets called for a lot more fouls. But about only 1 in every 8 times when the away team has a lot more possession does the home team get called for a lot more fouls.
What does that prove? Probably nothing; I mean not in any sense of a hardcore statistical proof. We’re making up cutoff points and mixing numbers from different distributions. It’s not ruthlessly rigorous.
But it is suggestive of something that’s becoming more and more accepted: that home field advantage in sports is largely a function of officiating. Here, when home teams are having to defend more of the game (i.e. getting outplayed), officials are possibly allowing them to get away with more fouls. Or, there is a relatively big difference between how many points we find in the bottom right compared to how many we find in the upper left.
If you’ve ever read the book Scorecasting, it’s loaded with examples of this. Many of them are pulled from academic papers. Here is one of the more easily accessible academic papers that Scorecasting references. It shows soccer officials, not wanting to suffer hostility from the home fans, give home teams more stoppage time to try to either earn a win or a draw (colloquially this is known as “Fergie Time”, even if that’s a bit of a misnomer for current purposes because a) Sir Alex got it regardless of whether his team was playing home or away and b) this paper studied La Liga).
Officials are human. Most of them anyway. They don’t want to get yelled at.
It’s not difficult to imagine there is a similar force at work here. In games where home teams have less possession, they are defending more. They are probably also fouling more. But because whistles against the home team would result in negative action from the crowd (e.g. boos, jeers. etc.), a referee might be inclined to swallow the whistle every now and then. It’s not necessarily a conscious decision, it just sort of happens, again, because officials are human (save Mike Dean, with one more eye he’d be a Cyclops).
Of course this comes with some caveats, beyond the fact that we’re trying to make sense of Premier League officials, which might be a priori ridiculous. There was a paper at Sloan in 2014 that looked at the qualitative difference between home possession and away possession. Basically what it found was that, on average, home teams have their possession higher up the pitch (toward the attacking third), while away teams average possession is a little father back. It’s prima facie support for the adage of: play for the win at home and the draw away.
It absolutely could have a mitigating effect here. If away teams are less threatening with their possession, then they simply might be getting fouled less. To what extent that could be partially accounting for the ‘fewer points upper left’ phenomenon is hard to say. Go back to the number of games we found on either end of the +/- 20% cutoff. The totals were only nine apart (167 to 158). That suggests that the teams that have a lot of possession at home also have a lot of possession on the road. And maybe it’s the sub-par teams REALLY sitting deep away that are influencing that average field position. How much that changes where that possession takes place I have no idea. We might still see some effects, but it’s probably less pronounced at the ends (and those are the games we’re looking at here). To really start separating those effects out, we’d need to start looking at more granular data on where fouls occur.
Moreover, we’re just counting. There is nothing to indicate the quality or influence of calls that were made or not made. Penalties or red cards, which can have large impacts on game outcomes, don’t carry any more weight than a mildly sloppy tackle in the center circle. Of course this also brings back to the idea of how a referee should behave (our possibly erroneous assumption that having the ball more means you will get fouled more); not to mention being a foul is sort of epistemologically slippery in the first place. Think about it in baseball terms: Is it a strike because a pitch crossed over part of the plate between a batter’s knees and his letters, or is it a strike because the umpire called it a strike? Fouls in soccer are even more subjective (unless maybe you’re Eric Gregg).
The possible influence of social pressure doesn’t do Arsenal much good this weekend, though. And it’s not just because the Emirates can be a bit light on hostile atmosphere. Nope, they happened to draw Bizarro Michael Jones in Oliver. His plot almost indicates he’s overcorrecting for any home-team partiality (subconscious or otherwise). Away teams get too fair a shake when he’s in charge. It’s not that Oliver won’t call more fouls on Chelsea; it’s just that no matter how much more possession Arsenal has, Oliver is not likely to whistle against Chelsea accordingly. So if Jose wants his players to sit back and kick some shins and ankles, they’re probably free to do it. And do it with immunity. Relatively speaking2.
Sure, it’s undermining our theory a little bit but human behavior isn’t uniform. And that somehow, days before the ball is even kicked, the fates have conspired to annoy Arsene Wenger might be something about the world we can observe more readily than trying to make sense of officials’ behavior.
1 I took the mean number of fouls committed by the home team, then added two standard deviations. So we’ve got a 1-in-20 number of fouls committed by the home team. From that I subtracted the average number of fouls committed by the away team. Then I divided that up by the total of the two. That equals .21. Flip the process and do the same to get the -.26.
2 Since this is going up after the fact… This is almost exactly what happened, particularly in the first half. And overall, Oliver officiated in a way consistent with his plot. Most notably, Bratislav Ivanovic basically fouled Arsenal players without consequence before the break. There were two incidents, either or both of which were easily bookable. Putting Ivanovic on a yellow 10-minutes in (or giving Arsenal a man advantage midway in the first half) would have had a significant impact on the game, but Oliver kept his cards in his pocket.