The Discreet Charm of Erroneous Rooney
One of the better professors I had taught that there are four basic questions you want to ask about any data you look at. The most important (and probably most obvious) is: Is it accurate?
A couple of weeks back, after Manchester United’s win at Liverpool, I noticed something on the shot charts that get Tweeted out. They were wrong or ‘wrong’ or the data they were using was wrong. The error was pretty easy to spot because it happened on the game’s only goal. And having just watched the game—it was barely 20 minutes since Wayne Rooney’s goal—I was convinced of the error enough to go back and look.
Sure enough, the position where Rooney took his shot on the actual pitch at Anfield was clearly not the same spot as where it was marked to have taken place in the data.
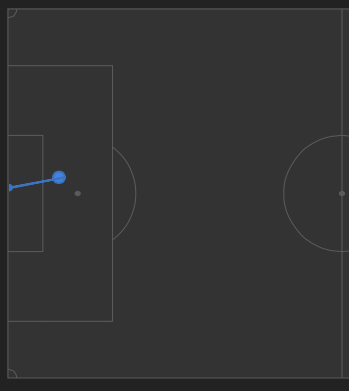
Here are the visuals to help decipher that. According to Opta, Rooney took his shot from the spot marked here:
According to life (or a second generation, twice lossy compressed phone pic of my TV’s freeze frame of a replay of said life), Rooney took his shot from here (not nearly as close to the spot, and looks like he’s even outside the frame of the goal):
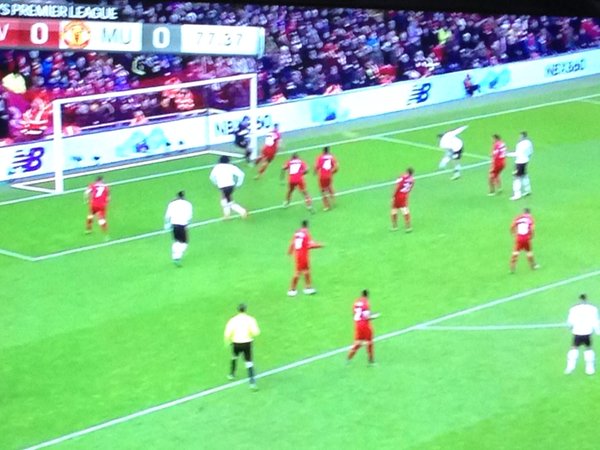
To me visually that’s not a trivial difference. Mathematically, it’s not either. From an expected goals standpoint1, it’s the difference between ~.21 (as marked) and ~.14 (reality… and while I made a best guess on the locations with the help of a grid overlay, there’s still no guarantee that my guess is 100% accurate as I’m still dealing with a shot from an angled perspective). So it’s off by 50%.
Is that a big deal? There are a few ways to look at it.
First, distance matters. You could decrease all of Phillipe Coutinho’s shots by 50% and you’d barely notice they had suddenly become even worse.
On the other hand, United only got off seven shots2 in this game so, if we’re looking at probable outcomes, the mathematical chance of a draw goes up about 4% 3 if that location is marked with more accuracy. That’s for a single shot being off by a small (but noticeable) amount. Congrats Liverpool. In the Math EPL you’ve actually got an additional .04 points on the table.
So, again, is that a big deal?
Well, ideally you want all your data to be accurate. Opta data is logged by hand in real time (at least from what little I know about it). Imagine watching a game and trying to assign a handful of variables to every pass, every touch, every shot. That sounds damn near impossible. But just reduce it to the fact that there are humans on the end of the process and of course there are going to be errors. But to show how much small errors can impact the data I created some.
By that I mean I created both data and errors.
First, I just randomly generated 11,000 shots. It wasn’t entirely random, I made a little function that roughly mimics about how many shots from different parts of the pitch happen in the EPL. Then I syphoned off 10,000 of the shots and built a dumb4 model for assigning probabilities to the shots. Then I took the remaining 1000 shots and ran them through the model to assign probabilities to them. Finally I turned those probabilities into a distribution of outcomes via running a bunch of simulations. That’s this histogram:
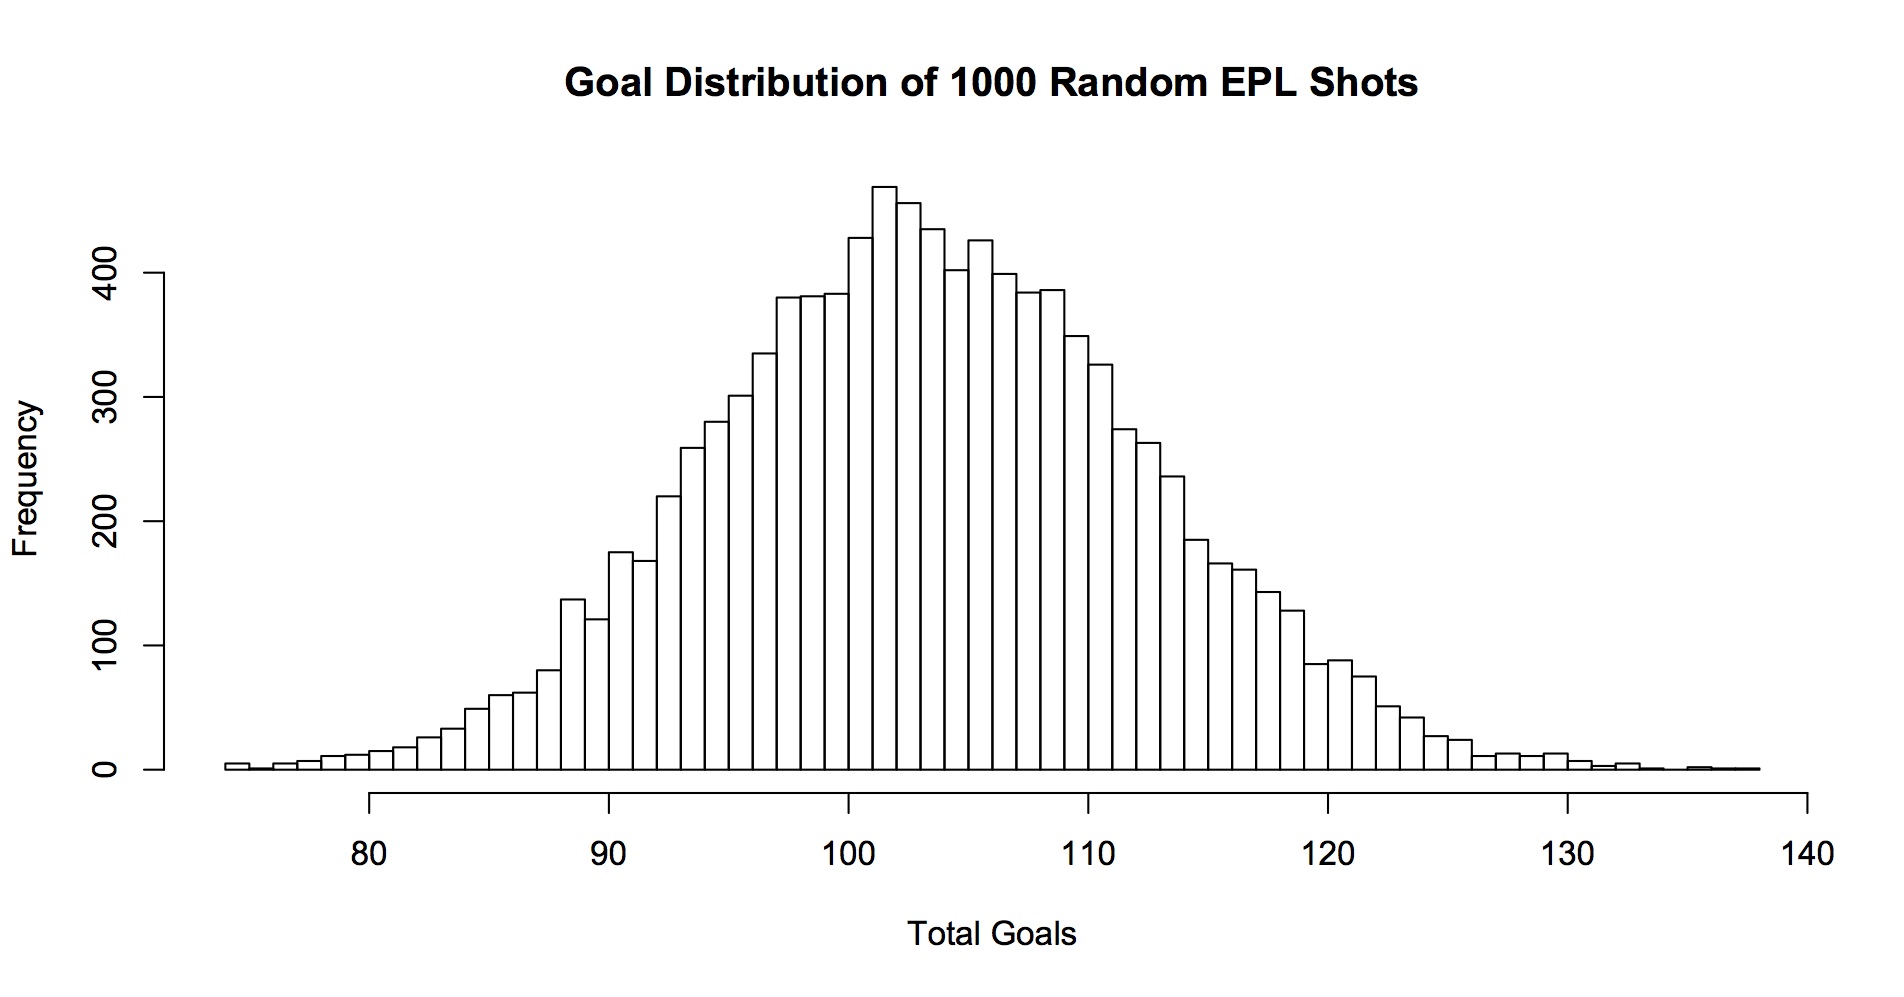
So we get the most ‘goals’ (or fake goals from our fake shots) at just a little over 100 (102 goals in about 430 of 10,000 sims). That’s pretty good. If I recall, non-penalty goals go in at something around a little north of .095 in the EPL in real life, so our model is pretty close.
Next we made some incorrect observations. Basically I took the same 1000 shots and changed most of them. But it wasn’t just random. I made some (possibly incorrect) assumptions about how the data is collected and how errors might occur if a person were watching in real time. If you’re watching a televised broadcast of the game, when the ball is around the goal on either end, you’re usually watching with a camera angled from somewhere near the center of the pitch. Basically, events closer to the near touchline might be easier to accurately locate than events toward the far side of the field. There are markings on the field that should help protect against this but it’s hard to know to what extent that’s helping. For example the Rooney shot had two or three good visual reference points but was still marked incorrectly by enough to notice.
Anyway, shots in the near third of the pitch were left untouched. Shots in the middle third were moved closer to goal in the horizontal distance (endline to endline) between 1% and 2% (just randomly generated values for each shot). Shots on the far third of the field were moved closer from between 1% to 3%. But both sets in the middle- and far-third were randomized between -1.5% and + 1.5% vertically (sideline to sideline). Point being: we’re trying (emphasis: try) to mimic how a human might (emphasis: might) make mistakes.
With those new values, the distribution now looks like this (the new distribution is the faded blue, the old is the faded red):
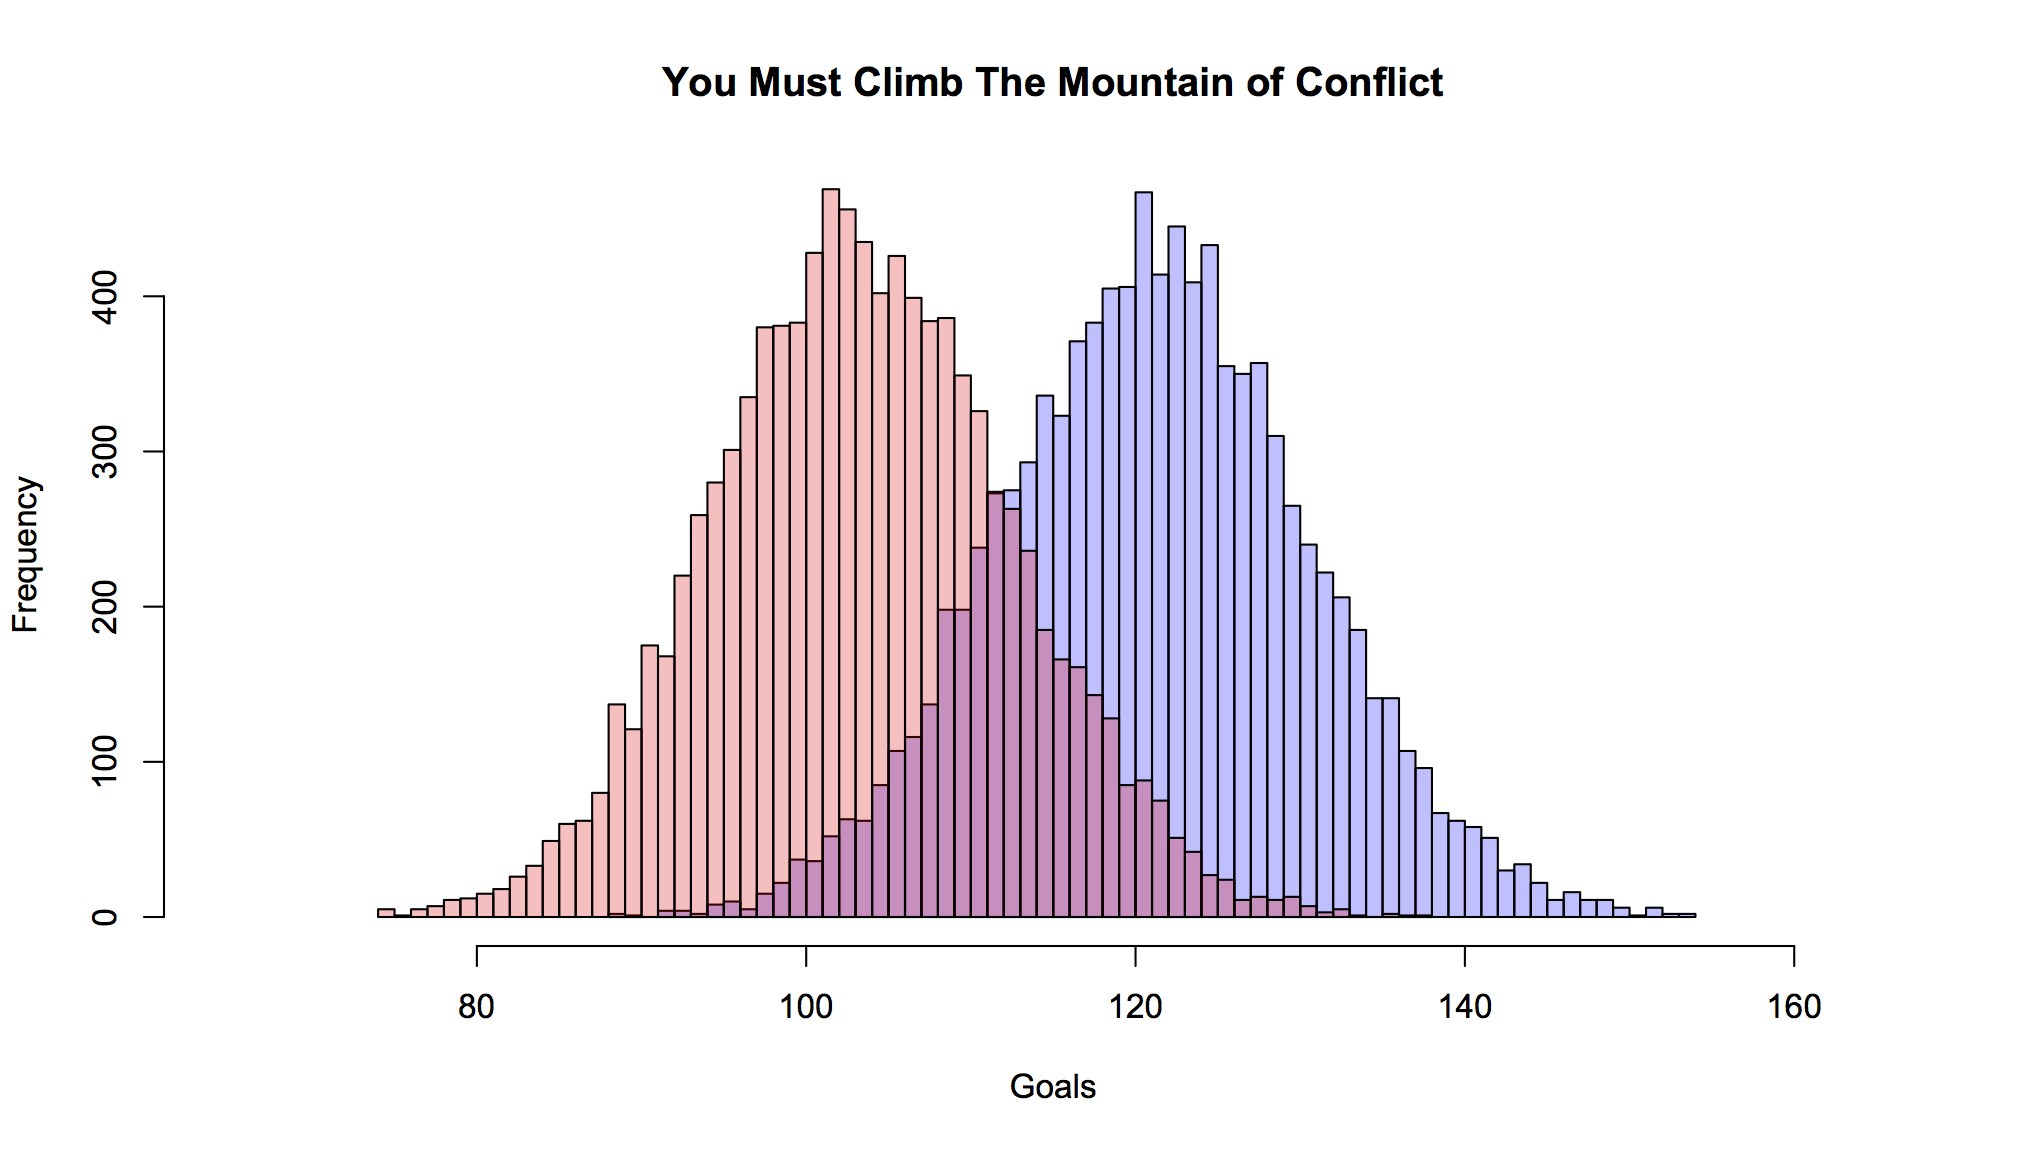
Over the 1000 shots we’ve got about 25 more goals. But we moved all the shots about 2.5% closer (on average), of course you got that many more ‘goals’. Not exactly. Remember we didn’t touch shots in a third of the pitch. And for some of the ones on the far end, being moved closer to goal also resulted in a slightly more acute angle, which decreases probability (a tiny bit). Plus a small subset of shots were moved father away just based on the rejiggering of the vertical locations. More importantly, probabilities don’t move linearly with increase/decrease in distance. Ultimately, yes, of course if, net, we have more shots closer to goal, we’re going to have more goals.
That’s not the point here. What is the point here?
Oh yeah, here we’re showing how tiny ‘errors’ in logging where a shot actually happened can lead to not tiny differences in just a fraction of the season. How many shots are there in a season? I feel like this is something I should know, but I think it’s somewhere around 10,000 (25 shots in 380 games would be 9500). Anyway, so in a tenth of that, we’re already +25 goals.
Now, most people pushing out ExpG numbers aren’t generally off by massive amounts. So if there are errors we’re probably seeing them at something close to being normally distributed5. One shot is a tiny bit closer, another is a little but farther away, over the length of the season, it’s not causing huge shifts in the numbers; or at least as far as we can tell from modeled outcomes, but those models are built on the very data whose accuracy we’re worrying about6.
At the very least, we should be almost certain that human fallibility is contributing to increased residual deviance in the modeling. On the bright side, of all the things that human fallibility is ruining, Liverpool’s after-the-fact chance of earning a draw at home against United is pretty low on the list.
1 Given the semantic corner I put myself in, this probably qualifies as my last post about expected goals. At it’s core this is actually more about human fallibility, but I’ll abide. It’s already liberating in the abstract.
2 Paraphrasing a friend: Van Gaal’s football jazz… it’s all the shots United don’t take.
3 That’s assuming the rest of the game plays out the same way, which is a terrible assumption. If Rooney drives that shot over the bar, it’s a goal kick to Liverpool and every kick for the last 15-ish minutes of the game is different. In that universe, Liverpool might go on to win 2-0.
4 By ‘dumb’ I mean we’re only using positional information. So just by creating a shot location we can know how far it was to goal and the visible angle. There are no other game factors here. Incidentally this is not a terrible model. It’s not great, but if you’re into stats and want to start doing something hands on, you could go manually grab 100-200 games, take the shot positions and run a regression. It might take a decent chunk of time, but it would get you a totally decent proto-model.
5 Again, given camera angles skewing a viewer’s perspective, I’m not entirely convinced that there isn’t some bit of systemic error in collection. Although there are good reasons for thinking that, even with the skewed perspective, the errors ‘even out’. But that’s a project for someone else who plans on being immortal such that time is essentially valueless to him or her.
6 Hi to anyone from Opta who runs across this. Just want to note that no Opta data was harmed (or, more importantly, used) in these calculations. It was all generated from scratch. Well, except for the WhoScored screenshot of the logged location of Rooney’s shot. Moreover, this isn’t an indictment of your business. As alluded to, I consider logging a few thousand events, each with multiple attributes, in realtime over the course of a game to be practically impossible.